
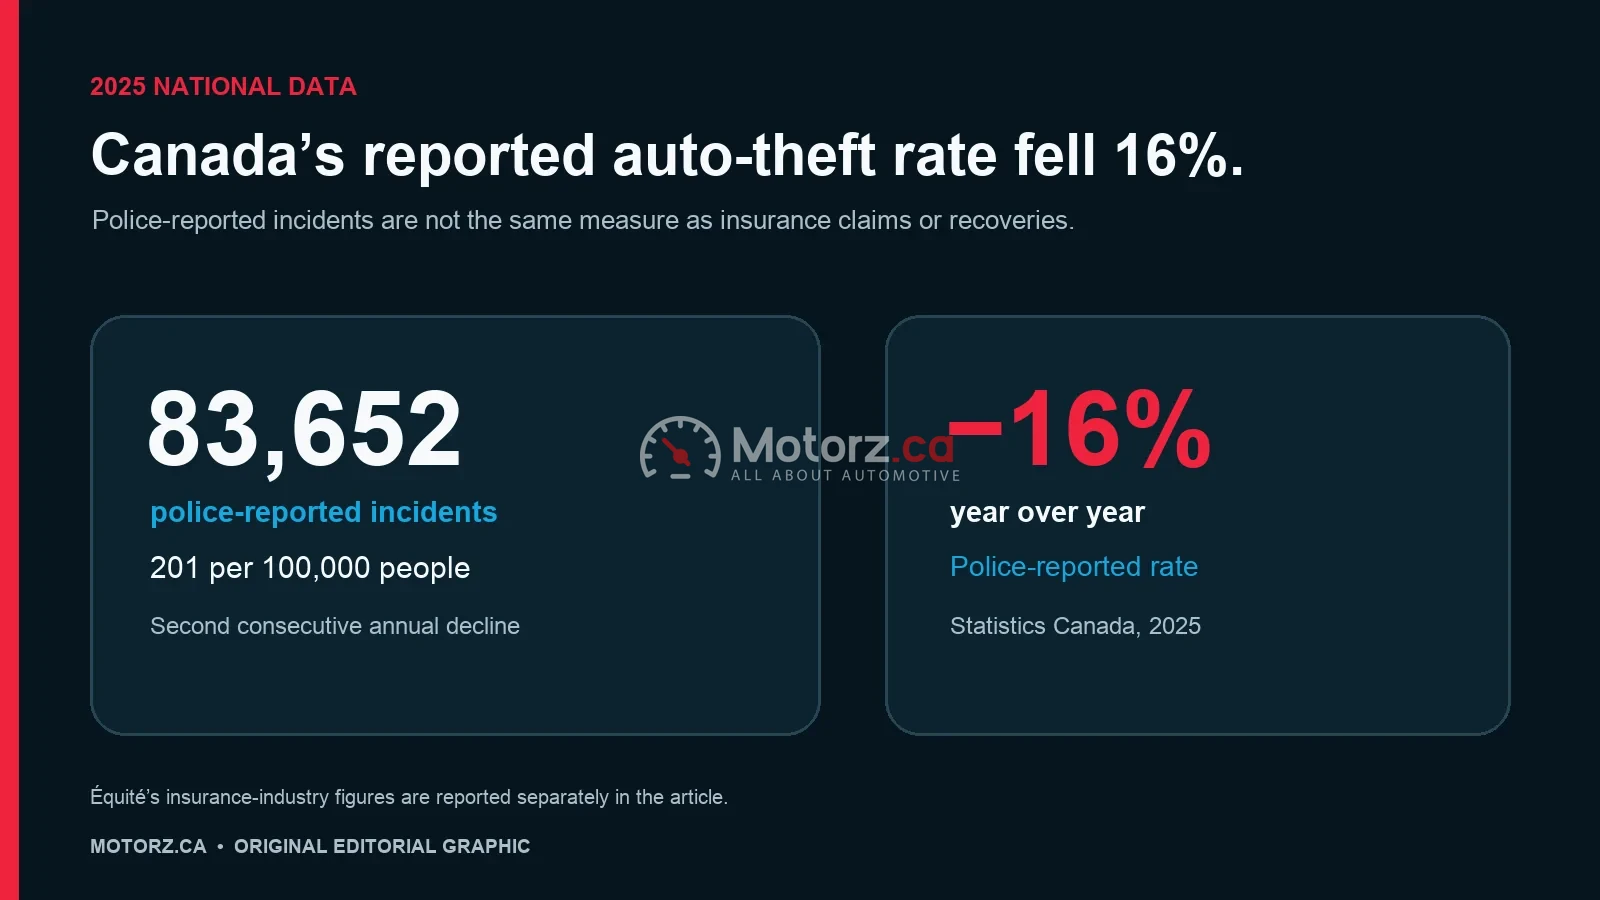
Canada recorded 83,652 police-reported motor vehicle theft incidents in 2025. The national rate fell 16% to 201 incidents per 100,000 people, marking a second consecutive annual decline—but it does not mean theft risk disappeared or that every region changed at the same pace.
Three useful datasets answer different questions. Statistics Canada measures police-reported incidents and rates. Équité Association reports insurance-industry trends, claims costs and recovery measures. Police services report local occurrences using their own definitions. Combining those numbers into one ranking would be misleading, so this article keeps them separate.
What Statistics Canada reported for 2025
Statistics Canada’s July 22, 2026 release says the police-reported motor vehicle theft rate declined 16% in 2025. The 83,652 incidents represented 201 per 100,000 people. It was the second yearly decline after three years of increases. The 2025 rate was 9% lower than in 2015 and 64% below the peak recorded in 2003.
These are police-reported national crime statistics. They are not an insurance-claim count, a count of unrecovered vehicles, or a prediction of an individual driver’s risk. Population, reporting practices and regional conditions matter when comparing places or years.
What the insurance-industry data adds
Équité Association’s 2025 trend report describes an 18% Canada-wide year-over-year decrease in its insurance-industry theft measure and estimates that vehicle-theft claims still cost insurers about $900 million in 2025. It reports regional declines of 22% in Ontario, 25% in Quebec, 11% in Western Canada and 2% in Atlantic Canada.
The same report lists recovery rates of 51% for Ontario, 48% for Quebec and 71% for Alberta. A recovery percentage describes the share recovered within that dataset; it is not the same as the number of thefts, the police-reported rate, or the financial value of claims.
A Toronto example—and an important methodology warning
Toronto Police Service’s 2025 annual report lists 7,421 auto-theft occurrences, down 23.9% from 2024. TPS also warns that its annual statistical report is not directly comparable with the public data portal: the annual report uses occurrences and includes unfounded events, while the portal is based on identified victims and excludes unfounded events.
That distinction illustrates why a single city number should not be pasted beside national or insurer figures without its definition and period. This article does not label any city, province or vehicle “most dangerous.”
Practical prevention steps from official guidance
- Lock the vehicle and close the windows, even for a short stop.
- Never leave keys or a running vehicle unattended.
- Park in a visible, well-lit place where possible; use motion lighting at home.
- Remove valuables and personal documents from view.
- Consider a visible physical deterrent, such as a steering-wheel lock, alongside built-in security.
- Keep identifying information available and report a theft to police and the insurer promptly.
- Do not confront someone you suspect is stealing a vehicle.
No device eliminates theft risk. Drivers should follow their manufacturer’s security guidance and avoid modifications that could interfere with safety systems or warranty coverage.
For adjacent ownership checks, see Motorz.ca’s explanation of what a vehicle-history report can and cannot show and its guide to checking current Canadian vehicle recalls.
Sources and limitations
National figures come from Statistics Canada’s 2025 police-reported crime release and its table 35-10-0177-01. Insurance-industry measures come from Équité Association’s 2025 Auto Theft Trend Report. The local example comes from the Toronto Police Service 2025 Annual Report. Prevention steps are based on RCMP guidance.
Update note: Sources were reconciled August 4, 2026. Review by October 5, 2026, or sooner when Statistics Canada, Équité Association or the cited police service revises the underlying data.