
Canada registered more zero-emission vehicles in the first quarter of 2026 than a year earlier, but fewer than in the final quarter of 2025. The result is a year-over-year rebound—not a broad market recovery.
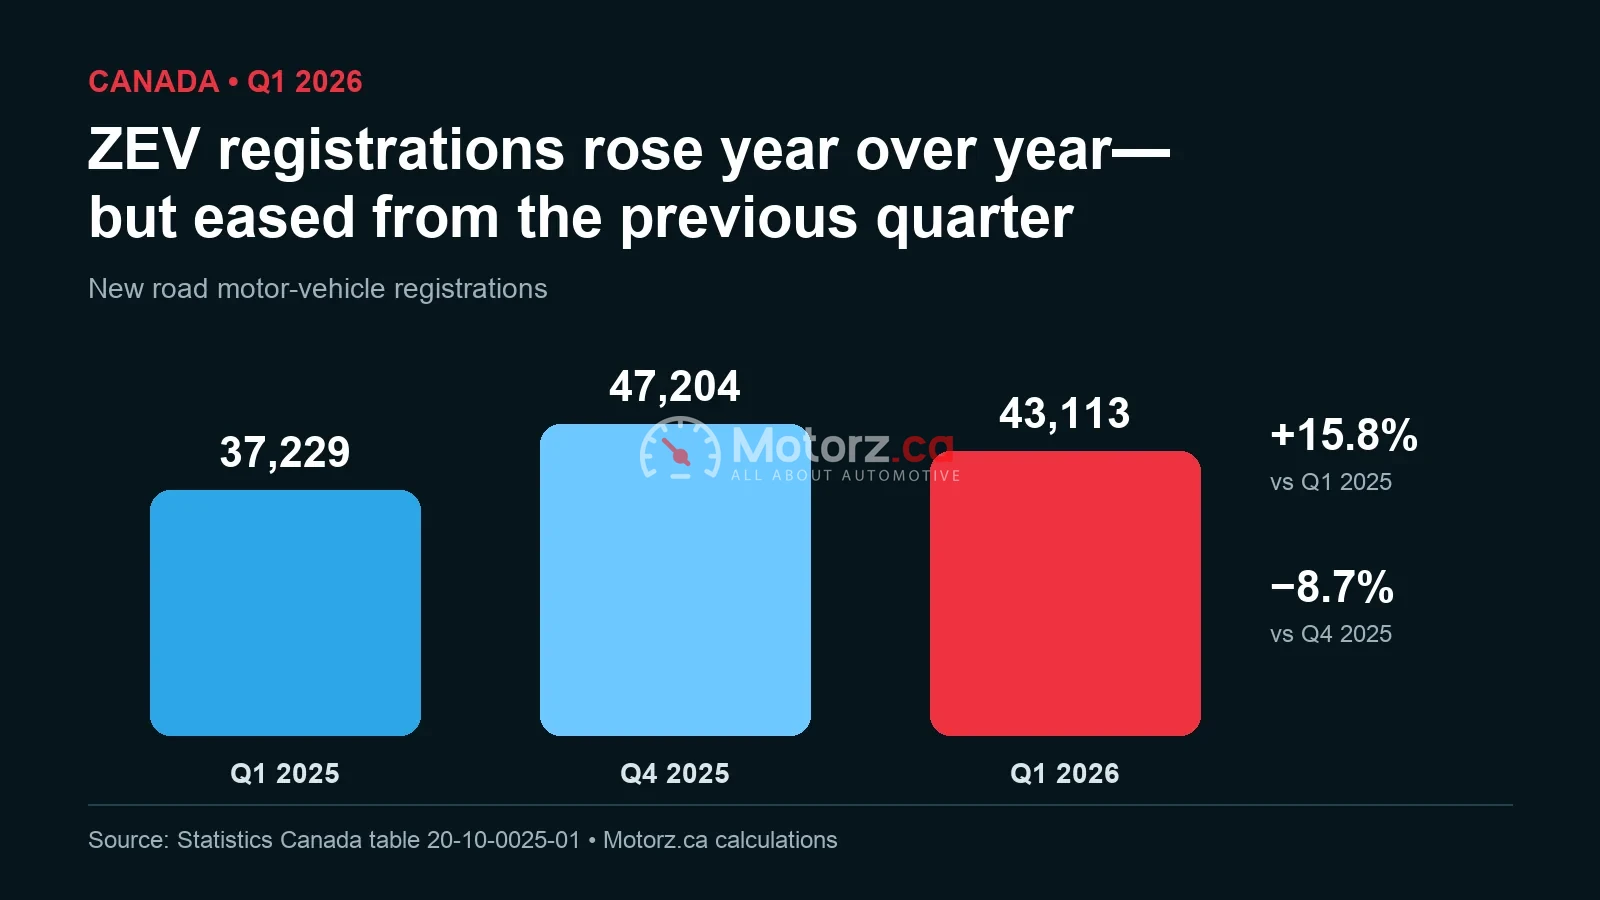
New Statistics Canada data show 43,113 zero-emission vehicles (ZEVs) were registered in Canada in Q1 2026. That was 15.8% more than the 37,229 registered in Q1 2025, but 8.7% fewer than the 47,204 registered in Q4 2025. Total new motor-vehicle registrations fell to 397,601, down 6.9% year over year.
The national picture
| Fuel type | Q1 2025 | Q4 2025 | Q1 2026 | Year over year | Quarter over quarter |
|---|---|---|---|---|---|
| All vehicles | 426,872 | 412,746 | 397,601 | −6.9% | −3.7% |
| All ZEVs | 37,229 | 47,204 | 43,113 | +15.8% | −8.7% |
| Battery electric | 26,401 | 31,482 | 29,808 | +12.9% | −5.3% |
| Plug-in hybrid | 10,828 | 15,722 | 13,305 | +22.9% | −15.4% |
| Hybrid electric | 53,828 | 50,478 | 53,584 | −0.5% | +6.2% |
Battery-electric vehicles accounted for 29,808 registrations and plug-in hybrids for 13,305. Both improved from Q1 2025, while both eased from the unusually strong final quarter of 2025. Conventional hybrids, which Statistics Canada does not include in its ZEV total, were nearly flat year over year at 53,584 and rose 6.2% from Q4.
Why “rebound” needs a qualifier
The cleanest interpretation is that ZEV registrations rebounded from their year-earlier level while losing momentum from the previous quarter. The broader market did not rebound: registrations across all fuel types declined in both comparisons. Gasoline registrations fell 9.2% year over year, while diesel registrations fell 25.8%.
Seasonality also matters. Comparing the same quarter in different years reduces—but does not eliminate—the effect of recurring seasonal patterns. A single quarter cannot establish a long-term trend, and registrations are not the same as vehicle orders, retail intent or vehicles currently on the road. For the following quarter, read the Q2 2026 provincial and powertrain registration breakdown; keep the reporting periods separate.
The provinces moved in different directions
Quebec recorded a 42.1% year-over-year increase in ZEV registrations. Manitoba rose 36.8%, Saskatchewan 22.1%, Ontario 5.0% and British Columbia 0.7%. Prince Edward Island, Nova Scotia, New Brunswick and Yukon declined. Statistics Canada suppressed the comparison values for Newfoundland and Labrador and Alberta. Nunavut’s Q1 value was zero in both years, so a percentage change cannot be calculated from a zero denominator. Motorz.ca does not estimate any of these percentages.
Those differences are a reminder that Canada is not one uniform EV market. Vehicle availability, provincial incentives, charging access, fleet purchasing and local economic conditions can all affect registrations. The data show where registrations changed, not why they changed.
What Canadian buyers can take from the data
- ZEV demand was stronger than a year earlier, even as the total vehicle market contracted.
- Plug-in hybrids posted the largest national year-over-year percentage gain among the ZEV categories.
- The Q4-to-Q1 decline argues against treating one strong annual comparison as uninterrupted growth.
- Provincial results varied sharply, so local incentives and charging conditions still matter to a buyer’s decision.
Drivers weighing powertrains can also read Motorz.ca’s guides to hybrid versus fully electric vehicles, EV practicality in Northern Ontario and Canada’s automotive manufacturing outlook.
Methodology and limitations
Motorz.ca downloaded Statistics Canada table 20-10-0025-01 on August 3, 2026. We filtered for Q1 2025, Q4 2025 and Q1 2026; Canada and every province or territory; total vehicle type; number of vehicles; and the published fuel categories. Percentage change is calculated as (new value − comparison value) / comparison value × 100 and rounded to one decimal place. We did not estimate suppressed values.
Statistics Canada applies random tabular adjustment to protect confidentiality, so component values may not add exactly to totals and small differences should not be over-interpreted. The source table may be revised. See the Q1 2026 release and table 20-10-0025-01.
Update note: Published from the Q1 2026 Statistics Canada release and complete table downloaded August 3, 2026. Motorz.ca will review this analysis when the next quarterly table is released.
Related analysis: compare provincial totals using Motorz.ca’s Q2 2026 new-registration rate per 100,000 residents.